We are more than two months into the 2024 MLB season and the sample sizes aren't small anymore. Those early season hot streaks are becoming legitimate breakouts and the slumps are becoming worrisome signs of decline. With that in mind, here are three MLB trends to watch now that we are well into June.
The sad state of center field in St. Louis
It wasn't too long ago that the Cardinals had more outfielders than outfield spots. As these things tend to do, that "problem" solved itself, and the Cardinals suddenly find themselves short in the outfield. Tyler O'Neill was traded, Dylan Carlson has regressed and been injured, Jordan Walker hasn't found his MLB sea legs yet, and Tommy Edman's return from wrist surgery has been slow.
Edman's slower than expected return and Carlson's spring shoulder injury (he got hurt in a collision with Walker) meant prospect Victor Scott II broke camp as the everyday center fielder. Scott might be the fastest man in baseball, he's an electrifying runner, but St. Louis skipped him over Triple-A and it showed. Scott hit .086/.139/.136 in 20 games before being returned to the minors.
Since late April, Michael Siani has been the club's everyday center fielder, and while he's a gifted defender, he hasn't hit at all. Siani's greatest contributions to the offense are his MLB-leading eight sacrifice bunts. The Cardinals claimed him off waivers from the Reds last September and now Siani has been thrust into everyday duty. That's the state of center field in St. Louis.
Between Scott being overmatched and Siani not doing much other than catching the ball, the Cardinals have the worst center field production in baseball this season at -0.8 WAR. The Dodgers and Rangers are a distant second worst at -0.2 WAR. Offensively, the center field outlook in St. Louis is bleak. Here are the worst center fields offensively:
| AVG | OBP | SLG | OPS+ |
|---|---|---|---|
30. Orioles: .172 | 30. Cardinals: .228 | 30. Cardinals: .227 | 30. Cardinals: 39 |
29. Cardinals: .177 | 29. Orioles: .235 | 29. Pirates: .279 | 29. Dodgers: 66 |
28. Dodgers: .183 | 28. Dodgers: .257 | 28. Dodgers: .288 | 28. Pirates: 68 |
... | ... | ... | ... |
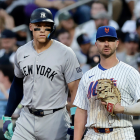
1. Padres: .278 | 1. Yankees: .403 | 1. Yankees: .625 | 1. Yankees: 207 |
It's been a rough fall from grace for Cedric Mullins in Baltimore, and that Aaron Judge guy is pretty good, but yeah, Cardinals center fielders have been the least productive center fielders in the game, and one of the least productive positions period. Only Red Sox second basemen (30 OPS+), Tigers shortstops (33 OPS+), and Marlins catchers (33 OPS+) have been worse offensively.
Carlson has drawn a few center field starts in recent days and could see more time there, though he took a .175/.277/.211 line into Tuesday's game and has an 88 OPS+ since finishing third in the NL Rookie of the Year voting in 2021. I'm not sure he's a solution at this point. There is still no firm timetable for Edman's return either. He recently started swinging a bat, and that's about it.
The Cardinals started 15-24 and have gone 16-10 since, putting them firmly in the wild-card mix. The trade deadline is seven weeks away. With Edman's status uncertain and Scott needing more minor league seasoning, center field help should be atop the deadline shopping list. Finding even a league average center fielder (old pal Harrison Bader?) would be a huge upgrade for the Cardinals.
Kansas City's low-strikeout bullpen
At 39-29 with a plus-65 run differential, the Royals are one of the biggest surprises in baseball this season. They spent some money in the offseason (Seth Lugo, Michael Wacha, etc.) and have ascendant young talent (most notably Bobby Witt Jr., but also Maikel Garcia, Vinnie Pasquantino, Cole Ragans, etc.), and the result is a team that looks nothing like last year's 56-106 outfit.
A postseason berth is within reach and there is one part of the roster the front office must attack at the deadline: the bullpen. Royals relievers ranks 20th in ERA (4.25), 22nd in WAR (0.6), and 24th in win probability added (0.10) this season. They're also dead last in strikeout rate: 18.0% of batters faced. The MLB average for relievers is 22.8% (the lowest since 2016!).
Not only do the Royals have the lowest bullpen strikeout rate in baseball this season, they have the lowest bullpen strikeout rate by any team in almost a decade. Excluding the 60-game pandemic season in 2020, here are the last five bullpens with an 18% strikeout rate or worse:
The 2013 Astros came as close to losing on purpose as maybe any team ever, and those mid-2010s Twins teams were behind the times. They chased quick outs on the ground. Minnesota eventually smartened up and realized the best teams miss bats, and that strikeouts are key in the late innings. Nothing bad can happen when you don't allow the ball to be put in play in close games.
Royals starters have a 23.0% strikeout rate, 12th highest in baseball and comfortably above the 21.9% league average for starters. The strikeout issue is limited to the bullpen and it is something Kansas City should look to correct at the deadline. I mean, they need to improve their bullpen in general, but specifically they need bat-missers. They allow way too many balls in play in the late innings.
Checking in on the MLB stolen base rate
Last season MLB implemented several significant rule changes, most notably the pitch clock and infield shift restrictions. It also introduced rules designed to promote stolen bases and more aggressive baserunning in general. Baserunning is exciting and MLB wants more of it. To do that, they installed larger bases and limited pitchers to two disengagements per plate appearance.
The rule changes worked as intended. The league stole 3,503 bases in 2023, the most since the wild west days of baserunning in 1987 (3,585 steals). It was the first year with 3,000 steals since 2012 (3,229). The league's 80.1% stolen base success rate was a record and not by a small margin either. The previous record was 75.7% in 2021.
How would players and teams approach stolen bases in Year 2 of the new rules? Would they attempt more steals? Would pitchers and defenses get better than preventing them? Now that we're roughly 40% of the way into the regular season, we're starting to get some answers. Here are the stolen base numbers entering play Tuesday:
| SB per game | SB success rate | SB attempt rate | |
|---|---|---|---|
2021 | 0.46 | 75.7% | 4.4% |
2022 | 0.51 | 75.4% | 5.0% |
2023 | 0.72 | 80.2% | 6.5% |
2024 | 0.73 | 78.4% | 6.9% |
The stolen base attempt rate is attempts per stolen base opportunity, with a stolen base opportunity defined as a runner on first or second base with the next base unoccupied. The league average attempt rate hovered in the 4% to 5% range for a long time. Now it's approaching 7%, so yes, when runners have the opportunity to steal, they are attempting a steal more often with the new rules.
Attempts are up, and the success rate is down from last season, though we're seeing almost exactly the same number of steals per game. The rise in attempts and decline in success rate have evened out thus far. We're talking small changes here -- one more attempt every 250 opportunities and one more caught stealing every 55 attempts, give or take -- but changes nonetheless.
Steals per game, success rate, and attempt rate all increased as last season progressed. I'm sure some of that was runners learning the new rules and figuring out exactly how far they can push things, though we should circle back in a few months and see whether there's another in-season increase in stolen bases. Like home runs, there are more steals in the summer months.
For now, steals per game are in the same range as last season. Few more attempts and a few more caught stealings, but not a massive change in one direction or the other. I was curious to see whether there would be even more attempts out of the gate this year now that players are familiar with the rules and how to leverage them, but that hasn't happened yet.